


Time series data is a distinct category that incorporates time as a fundamental element in its structure. In a time series, data points are collected sequentially, often at regular intervals, and they typically exhibit certain patterns, such as trends, seasonal variations, or cyclical behaviors. Common examples of time series data include sales revenue, system performance data (such as CPU utilization and memory usage), credit card transactions, sensor readings, and user activity analytics.
Time series anomaly detection is the process of identifying unexpected or unusual patterns in data that unfold over time. An anomaly, also known as an outlier, occurs when a data point deviates significantly from an expected pattern.
For some time series, like those with well-defined expected ranges such as machine operating temperatures or CPU usage, a threshold-based approach might suffice. However, in areas like fraud detection and sales, where simple rules fall short due to their inability to catch anomalies across complex relationships, more sophisticated techniques are required to identify unexpected occurrences.
In this post, we demonstrate how to build a robust real-time anomaly detection solution for streaming time series data using Amazon Managed Service for Apache Flink and other AWS managed services.
Solution overview
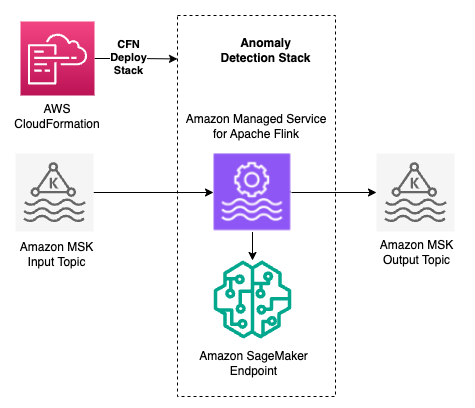
The following diagram illustrates the core architecture of the Anomaly Detection Stack solution.
This solution employs machine learning (ML) for anomaly detection, and doesn’t require users to have prior AI expertise. It offers an AWS CloudFormation template for straightforward deployment in an AWS account. With the CloudFormation template, you can deploy an application stack with the necessary AWS resources required for detecting anomalies. Setting up one stack creates an application with one anomaly detection task or detector. You can set up multiple such stacks to run them simultaneously, with each one analyzing the data and reporting back the anomalies.
The application, once deployed, constructs an ML model using the Random Cut Forest (RCF) algorithm. It initially sources input time series data from Amazon Managed Streaming for Apache Kafka (Amazon MSK) using this live stream for model training. Post-training, the model continues to process incoming data points from the stream. It evaluates these points against the historical trends of the corresponding time series. The model also generates an initial raw anomaly score while processing and maintains an internal threshold to eliminate noisy data points. Subsequently, the model generates a normalized anomaly score for each data point that the model treats as an anomaly. These scores, ranging from 0–100, indicate the deviation from typical patterns; scores closer to 100 signify higher anomaly levels. You have the flexibility to set a custom threshold on these anomaly scores, allowing you to define what you consider anomalous.
This solution uses a CloudFormation template, which takes inputs such as MSK broker endpoint and topics, AWS Identity and Access Management (IAM) roles, and other parameters related to virtual private cloud (VPC) configuration. The template creates the essential resources like the Apache Flink application and Amazon SageMaker real-time endpoint in the customer account.
To request the access to this solution, send an email to anomalydetection-support-canvas@amazon.com.
In this post, we outline how you can build an end-to-end solution with the Anomaly Detection Stack. Consider a hypothetical sales scenario where AnyBooks, an on-campus bookstore at a large university, sells various supplies to college students. Due to the timing of class schedules, their seasonality is such that they sell around 20 Item-A units and 30 Item-B units during even hours, and approximately half that during odd hours throughout the day. Recently, there have been some unexplained spikes in the quantity of items sold, and the management team wants to start tracking these quantity anomalies so that they can better plan their staffing and inventory levels.
The following diagram shows the detailed architecture for the end-to-end solution.
In the following sections, we discuss each layer shown in the preceding diagram.
Ingestion
In the ingestion layer, an AWS Lambda function retrieves sales transactions for the current minute from a PostgreSQL transactional database, transforms each record into a JSON message, and publishes it to an input Kafka topic. This Lambda function is configured to run every minute using Amazon EventBridge Scheduler.
Anomaly detection stack
The Flink application initiates the process of reading raw data from the input MSK topic, training the model, and commencing the detection of anomalies, ultimately recording them to the MSK output topic. The following code is the output results JSON:
The following is a brief explanation of the output fields:
measure – This represents the metric we are tracking for anomalies. In our case, the measure field is the quantity of sales for Item-A.
aggregatedMeasureVaue – This represents the aggregated value of quantity in the time window.
timeseriesid – This unique identifier corresponds to a combination of unique values for the dimensions and the metric. In this scenario, it’s the product name, Item-A, within the product_name
anomalyConfidenceScore – As the model evolves through learning and inference, this confidence score will progressively improve.
anomalyScore – This field represents the score for anomaly detection. With an anomalyThreshold set at 70, any value exceeding 70 is considered a potential anomaly.
modelStage – When the model is in the learning phase, the anomalyScore is 0.0 and the value of this field is set to LEARNING. After the learning is complete, the value of this field changes to INFERENCE.
anomalyDecisionThreshold – The decision threshold is provided as input in the CloudFormation stack. If you determine there are too many false positives, you can increase this threshold to change the sensitivity.
anomalyDecision – If the anomalyScore exceeds the anomalyDecisionThreshold, this field is set to 1, indicating an anomaly is detected.
Transform
In the transformation layer, an Amazon Data Firehose stream is configured to consume data from the output Kafka topic and invoke a Lambda function for transformation. The Lambda function flattens the nested JSON data from the Kafka topic. The transformed results are then partitioned by date and stored in an Amazon Simple Storage Service (Amazon S3) bucket in Parquet format. An AWS Glue crawler is used to crawl the data in the Amazon S3 location and catalog it in the AWS Glue Data Catalog, making it ready for querying and analysis.
Visualize
To visualize the data, we’ve created an Amazon QuickSight dashboard that connects to the data in Amazon S3 through the Data Catalog and queries it using Amazon Athena. The dashboard can be refreshed to display the latest detected anomalies, as shown in the following screenshot.
In this example, the darker blue line in the line graph represents the seasonality of the quantity measure for Item-A over time, showing higher values during even hours and lower values during odd hours. The pink line represents the anomaly detection score, plotted on the right Y-axis. The anomaly score approaches 100 when the quantity value significantly deviates from its seasonal pattern. The blue line represents the anomaly threshold, set at 70. When anomalyScore exceeds this threshold, anomalyDecision is set to 1.
The “Number of Timeseries Tracked” KPI displays how many time series the model is currently monitoring. In this case, because we’re tracking two products (Item-A and Item-B), the count is 2. The “Number of Datapoints Processed” KPI shows the total number of data points the model has processed, and the “Anomaly Confidence Score” indicates the confidence level in predicting anomalies. Initially, this score is low, but will approach 100 as the model matures over time.
Notification
Although visualization is valuable for investigating anomalies, data analysts often prefer to receive near real-time notifications for critical anomalies. This is achieved by adding a Lambda function that reads results from the output Kafka topic and analyzes them. If the anomalyScore value exceeds the defined threshold, the function invokes an Amazon Simple Notification Service (Amazon SNS) topic to send email or SMS notifications to a designated list, alerting the team about the anomaly in near real time.
Conclusion
This post demonstrated how to build a robust real-time anomaly detection solution for streaming time series data using Managed Service for Apache Flink and other AWS services. We walked through an end-to-end architecture that ingests data from a source database, passes it through an Apache Flink application that trains an ML model and detects anomalies, and then lands the anomaly data in an S3 data lake. The anomaly scores and decisions are visualized through a QuickSight dashboard connected to the Amazon S3 data using AWS Glue and Athena. Additionally, a Lambda function analyzes the results and sends notifications in near real time.
With AWS managed services like Amazon MSK, Data Firehose, Lambda, and SageMaker, you can rapidly deploy and scale this anomaly detection solution for your own time series use cases. This allows you to automatically identify unexpected behaviors or patterns in your data streams in real time without manual rules or thresholds.
Give this solution a try, and explore how real-time anomaly detection on AWS can unlock insights and optimize operations across your business!
About the Authors
Noah Soprala is a Solutions Architect based out of Dallas. He is a trusted advisor to his customers and helps them build innovative solutions using AWS technologies. Noah has over 20 years of experience in consulting, development, and solution architecture and delivery.
Dan Sinnreich is a Sr. Product Manager for Amazon SageMaker, focused on expanding no-code / low-code services. He is dedicated to making ML and generative AI more accessible and applying them to solve challenging problems. Outside of work, he can be found playing hockey, scuba diving, and reading science fiction.
Syed Furqhan is a Senior Software Engineer for AI and ML at AWS. He was part of many AWS service launches like Amazon Lookout for Metrics, Amazon Sagemaker and Amazon Bedrock. Currently, he is focusing on generative AI initiatives as part of Amazon Bedrock Core Systems. He is a clean code advocate and a subject-matter expert on server-less and event-driven architecture. You can follow him on linkedin, syedfurqhan
Nirmal Kumar is Sr. Product Manager for the Amazon SageMaker service. Committed to broadening access to AI/ML, he steers the development of no-code and low-code ML solutions. Outside work, he enjoys travelling and reading non-fiction.
